~9%
Cost Decrease
$1,683/year in inventory savings.
Evaluated five forecasting models on 5 years of daily demand, optimized a continuous-review inventory policy via Monte Carlo simulation, and cut total cost by ~9% while sustaining ≥ 95% service.
~9%
Cost Decrease
$1,683/year in inventory savings.
≈95%
Service Level
Target met via simulation.
24
Fewer POs/Year
149 → 125 annually.
Simulation Results
10,000 Runs · Grid-Search
| Metric | Baseline R=92 · Q=42 | Optimized R=86 · Q=49 | Delta |
|---|---|---|---|
| Total Cost / Day | $50.94 | $46.33 | -$4.61/day |
| Service Level | 96.8% | 95.0% | -1.8pp (still ≥ 95%) |
| Holding Cost / Day | $30.48 | $29.21 | -$1.27 |
| Ordering Cost / Day | $20.46 | $17.12 | -$3.34 |
| POs / Year | 149 | 125 | -24 |
| Annualized Total | $18,593 / yr | $16,910 / yr | ↓ $1,683 / yr |
Exploration · Tableau
5 Years · Single SKU
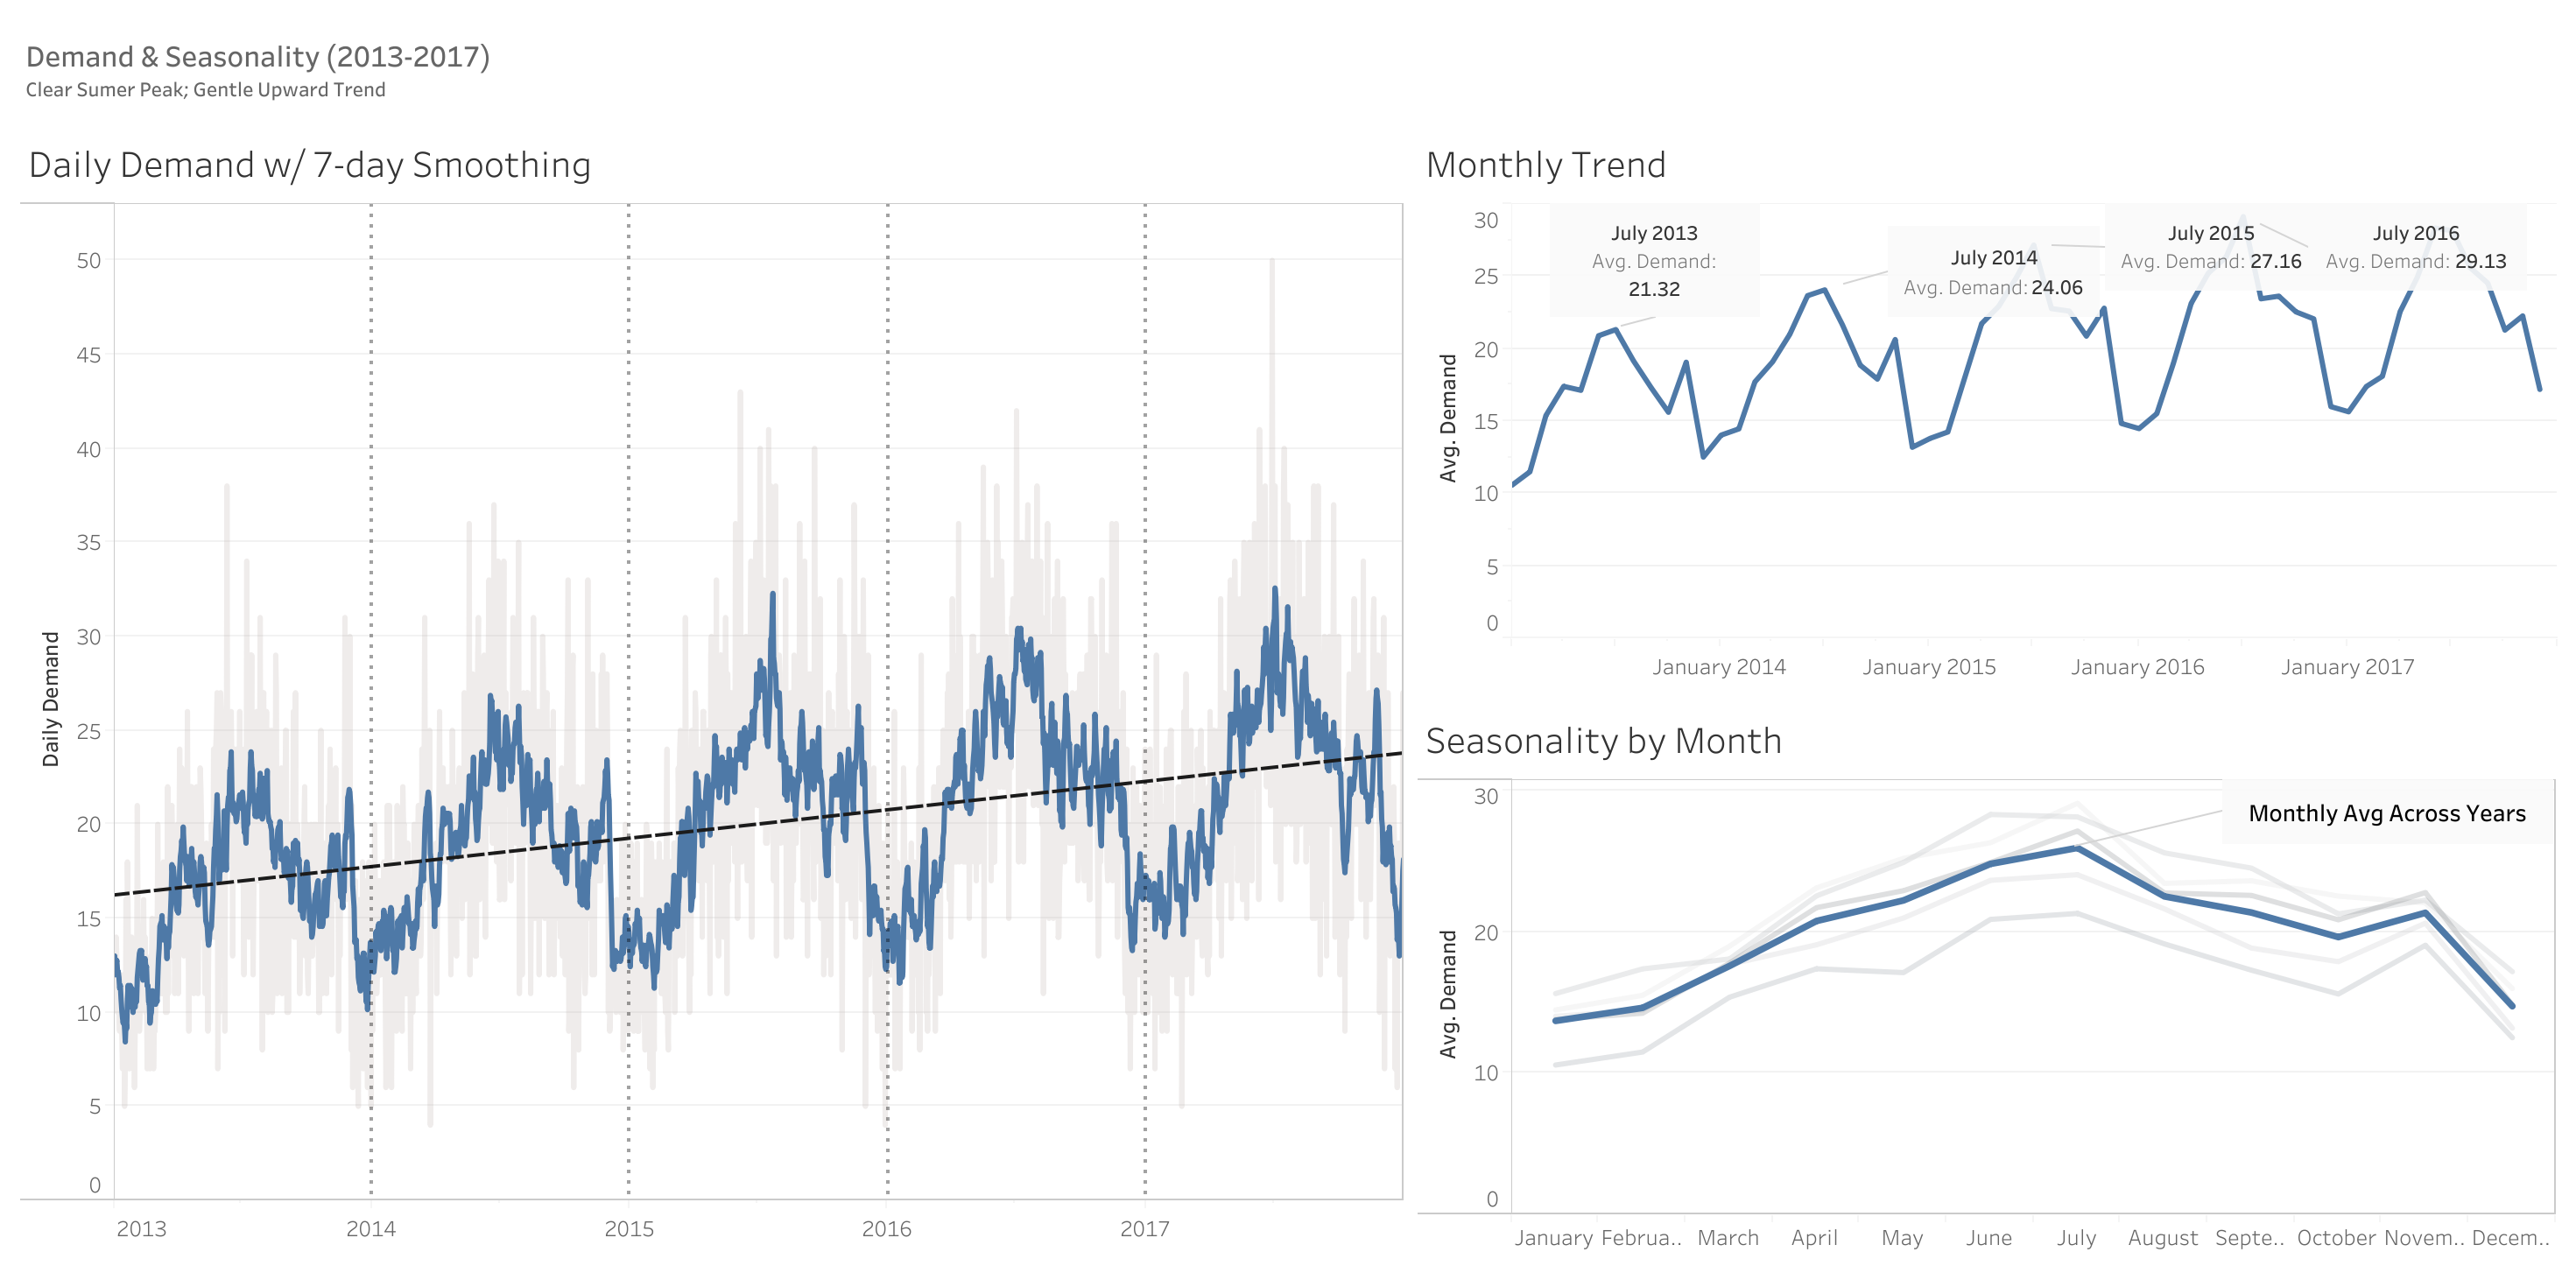
Exploratory analysis across 5 years of daily demand surfaced a clear upward trend, recurring monthly seasonality, and high day-to-day variability.
Methodology