0.034
Customer HHI
Low concentration — no single customer exceeds ~9% of total revenue.
Evaluates revenue growth dynamics, customer concentration risk, and internal SKU dependency using HHI, effective counts, and Pareto concentration modeling.
0.034
Customer HHI
Low concentration — no single customer exceeds ~9% of total revenue.
0.142
Category HHI
Balanced category exposure; top 2 categories contribute ~40% of revenue.
3–4
Effective SKUs
Driving Category 1 revenue despite 12 total SKUs in the category.
Insight 1 · Revenue Growth
Growth Accelerating
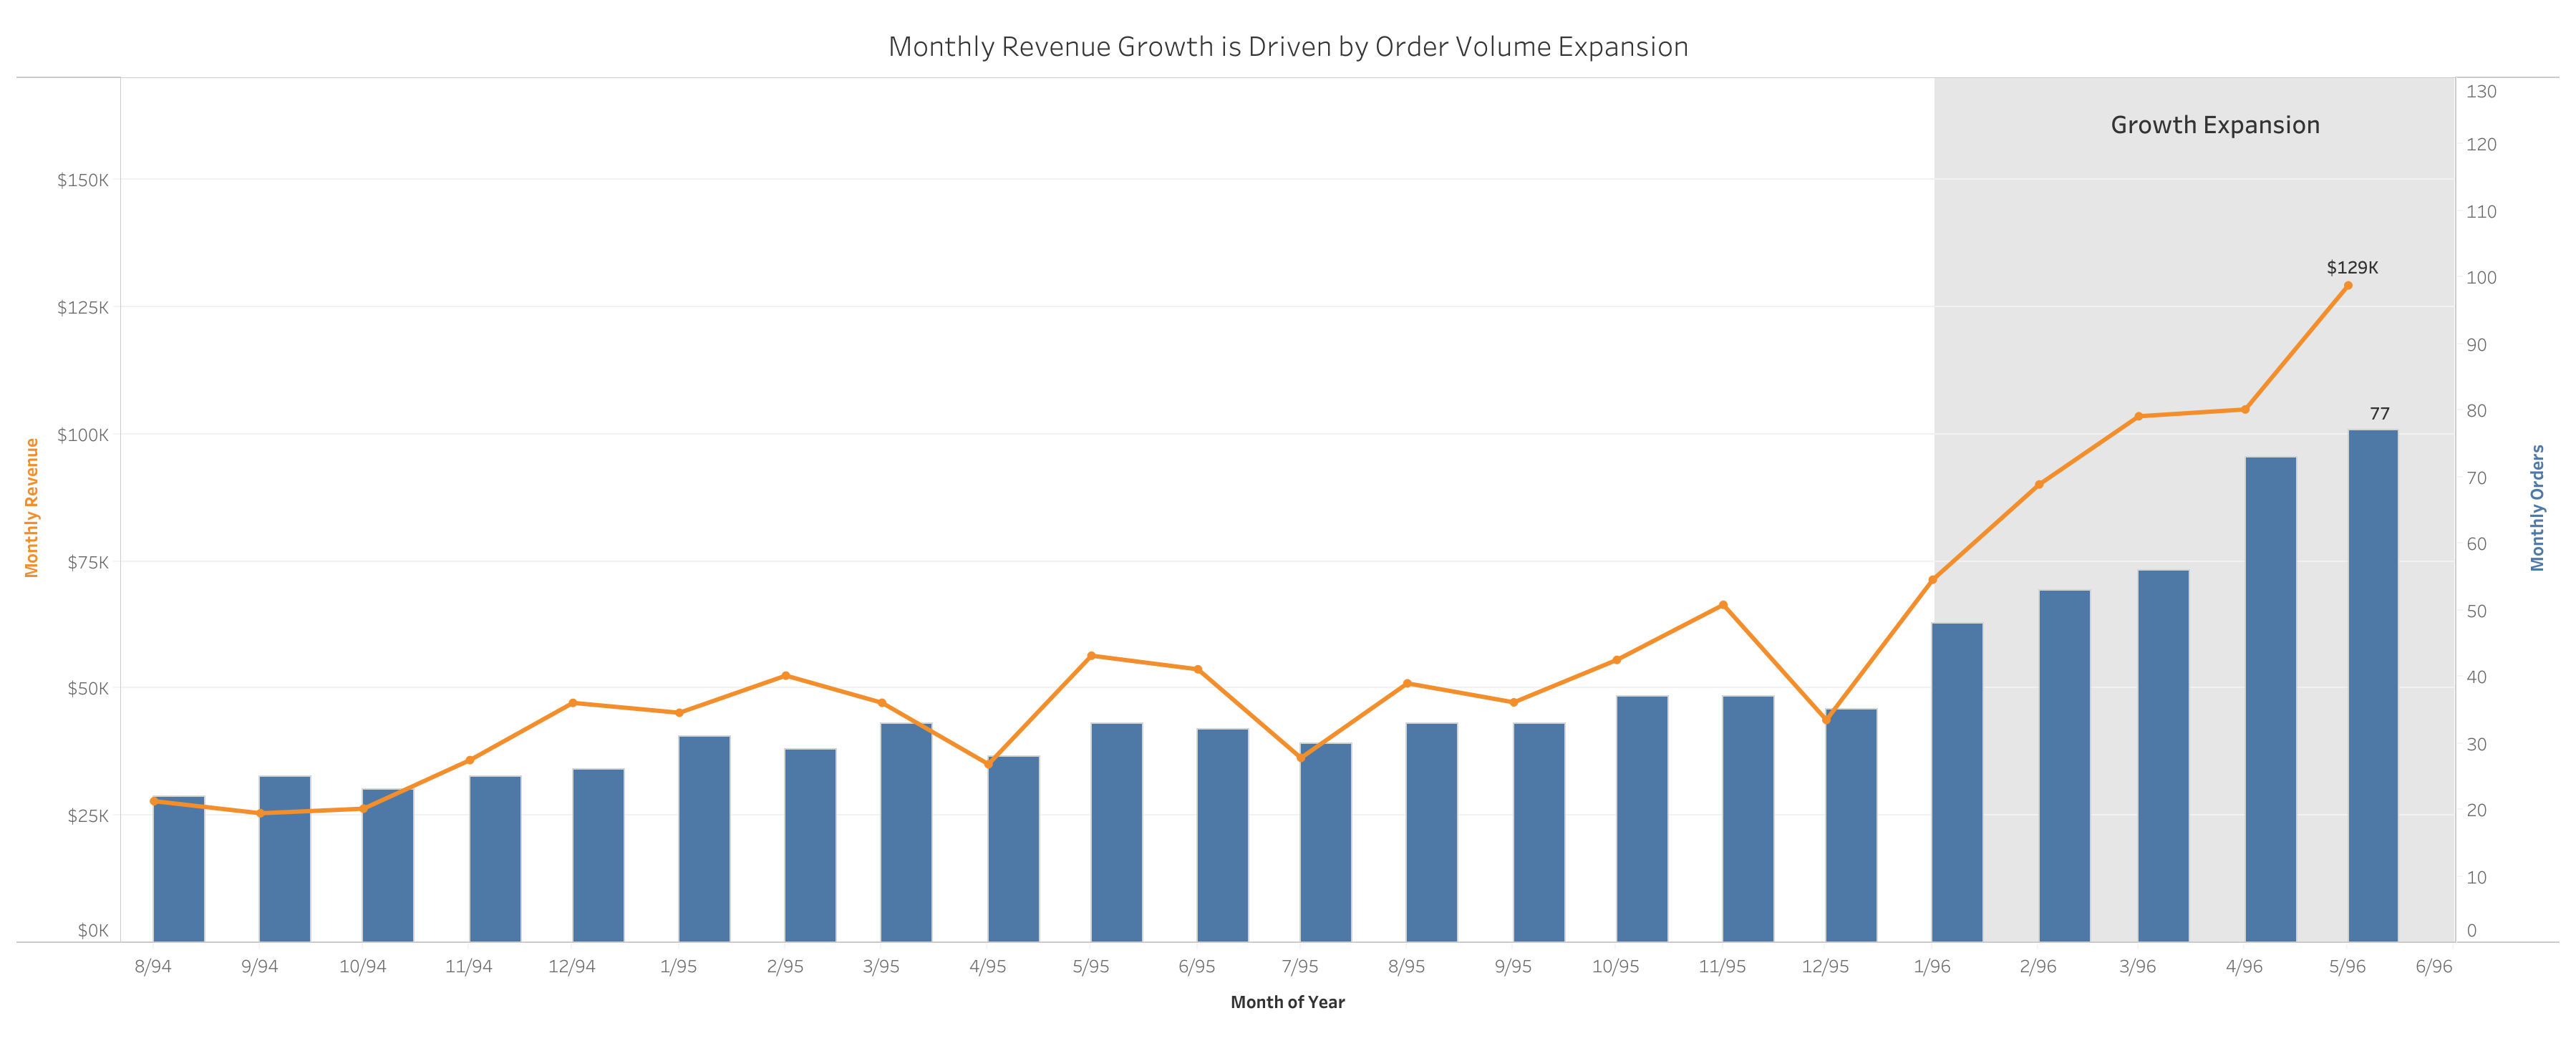
Revenue accelerated sharply in the last five months, with monthly orders reaching 77 and revenue hitting ~$129K. AOV remained stable and new customer acquisition stayed minimal, confirming growth is primarily volume-driven rather than price inflation.
Insight 2 · Customer Concentration
Low Risk
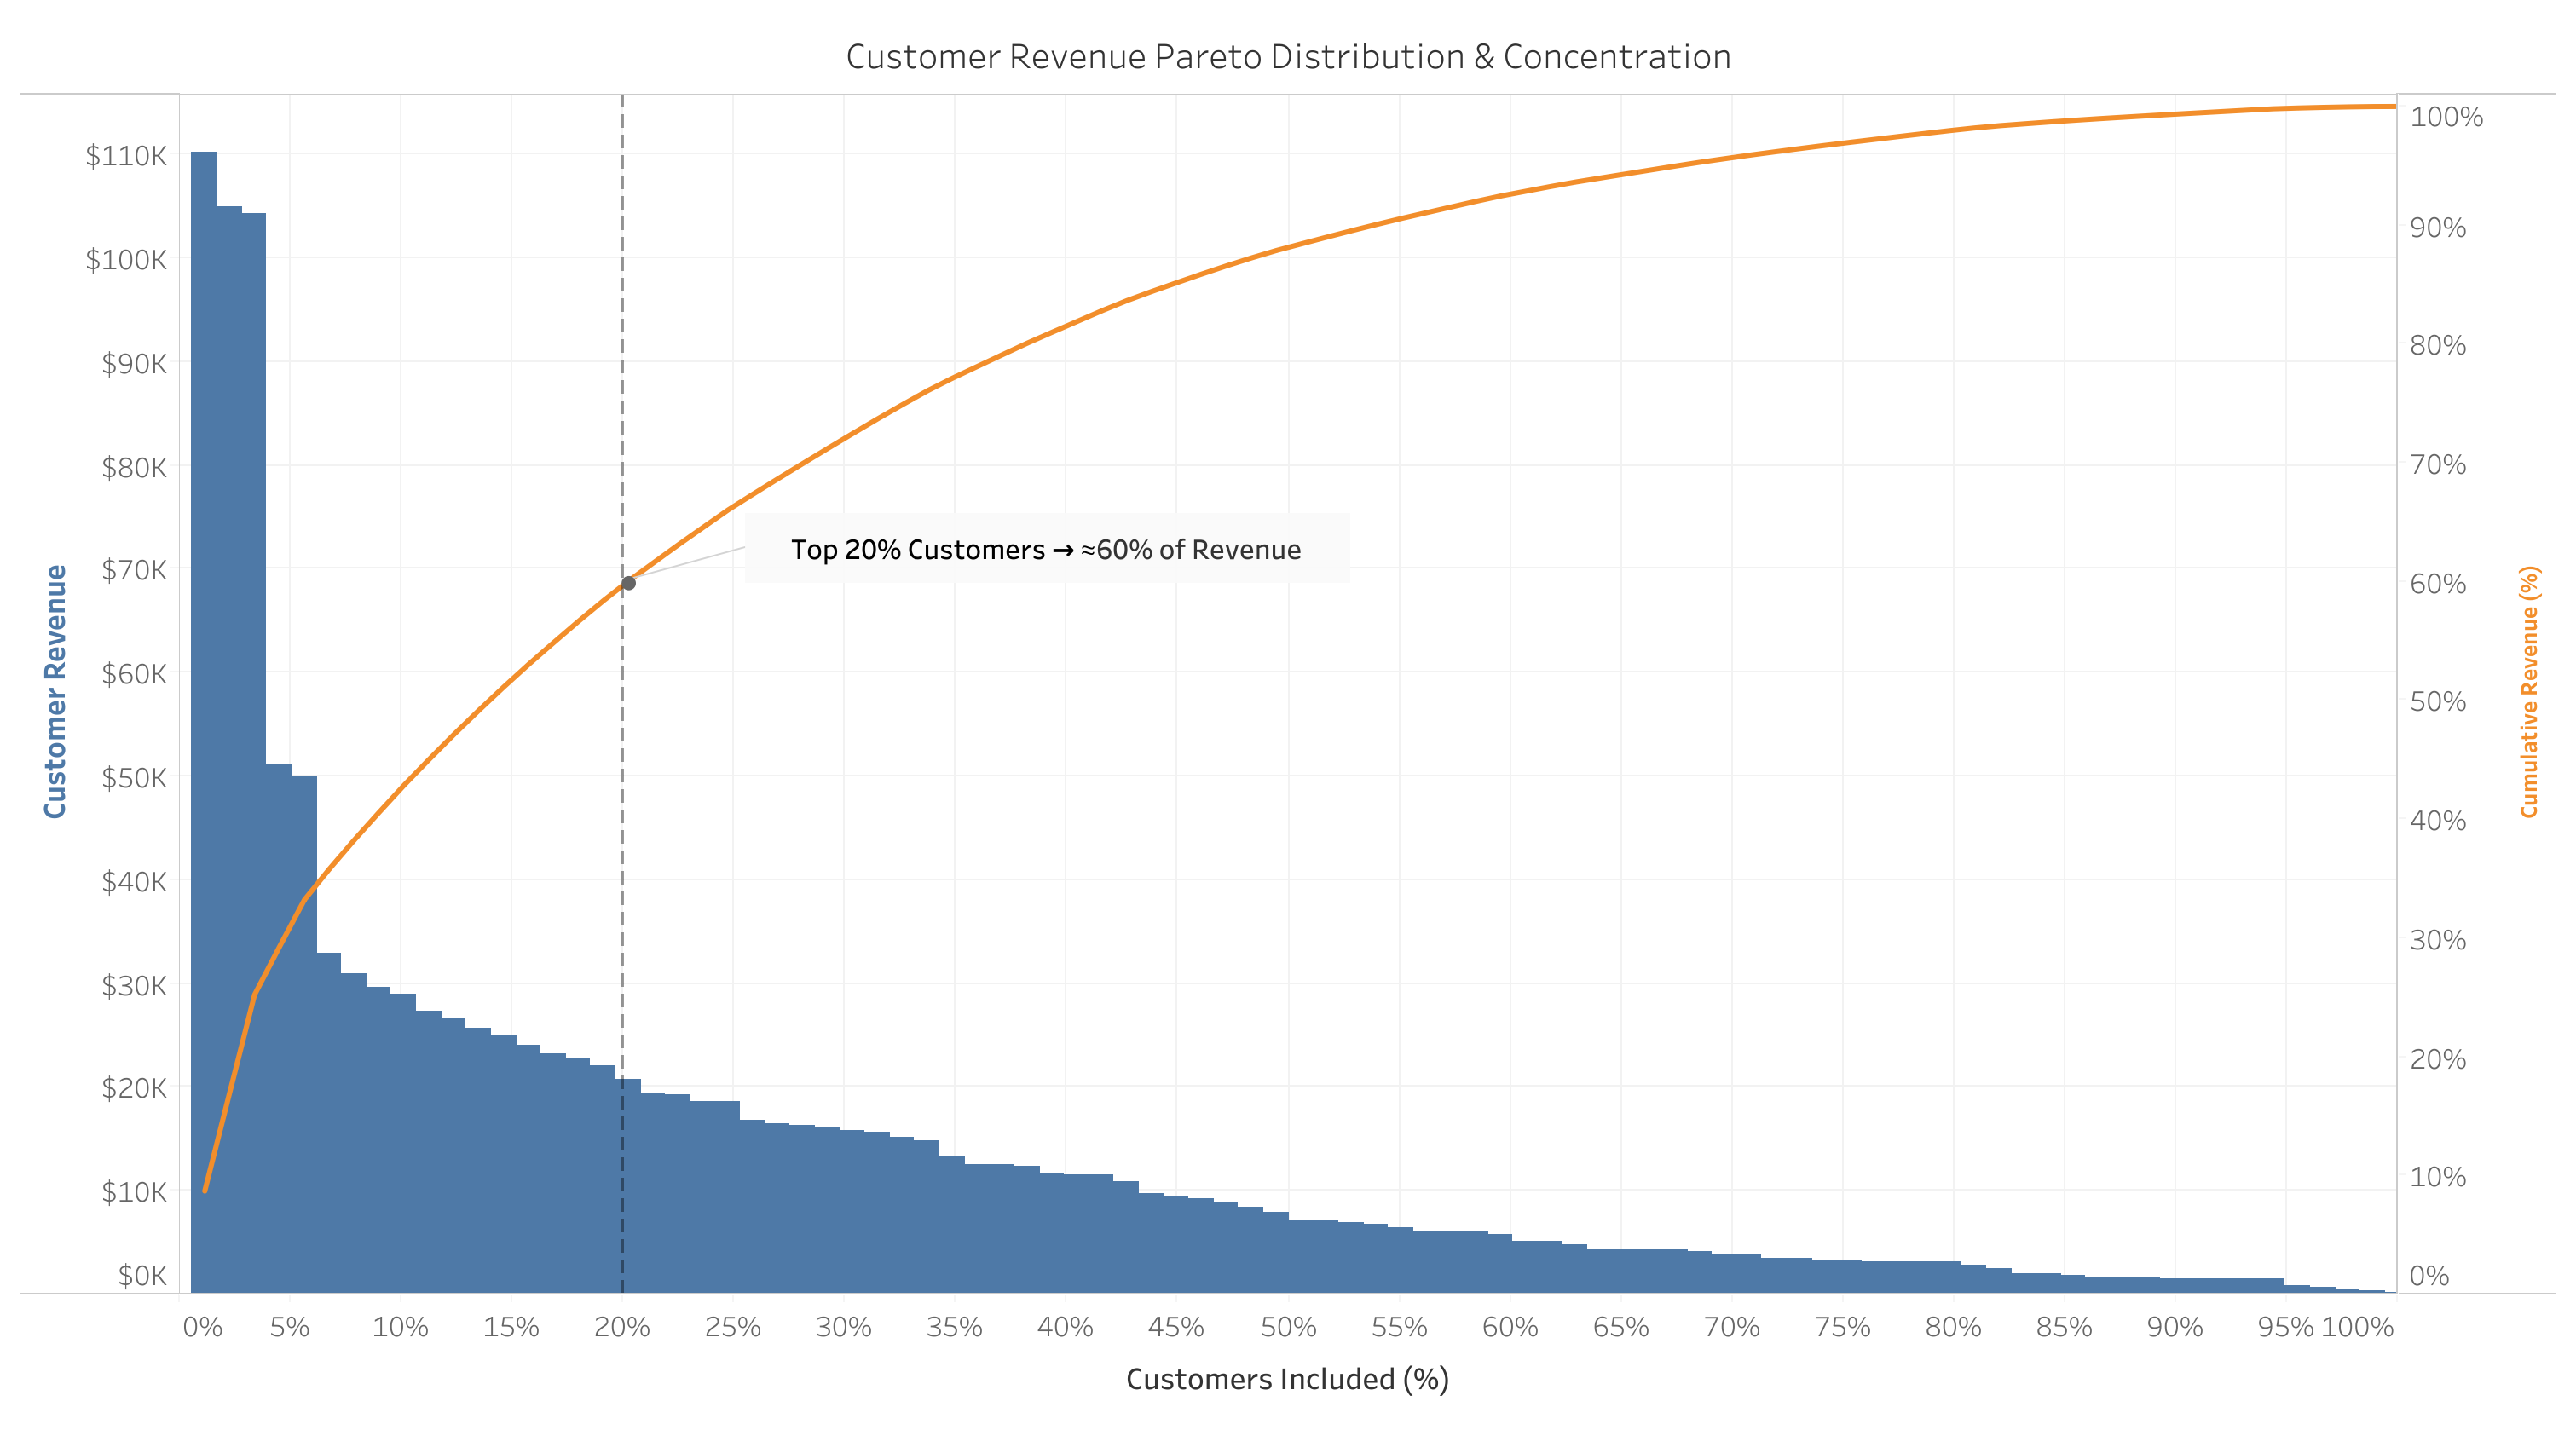
Top 20% of customers generate about 60% of revenue, indicating a mild Pareto curve. Customer HHI of 0.034 confirms low dependency risk at the customer level.
Insight 3 · SKU Dependency
Moderate Risk
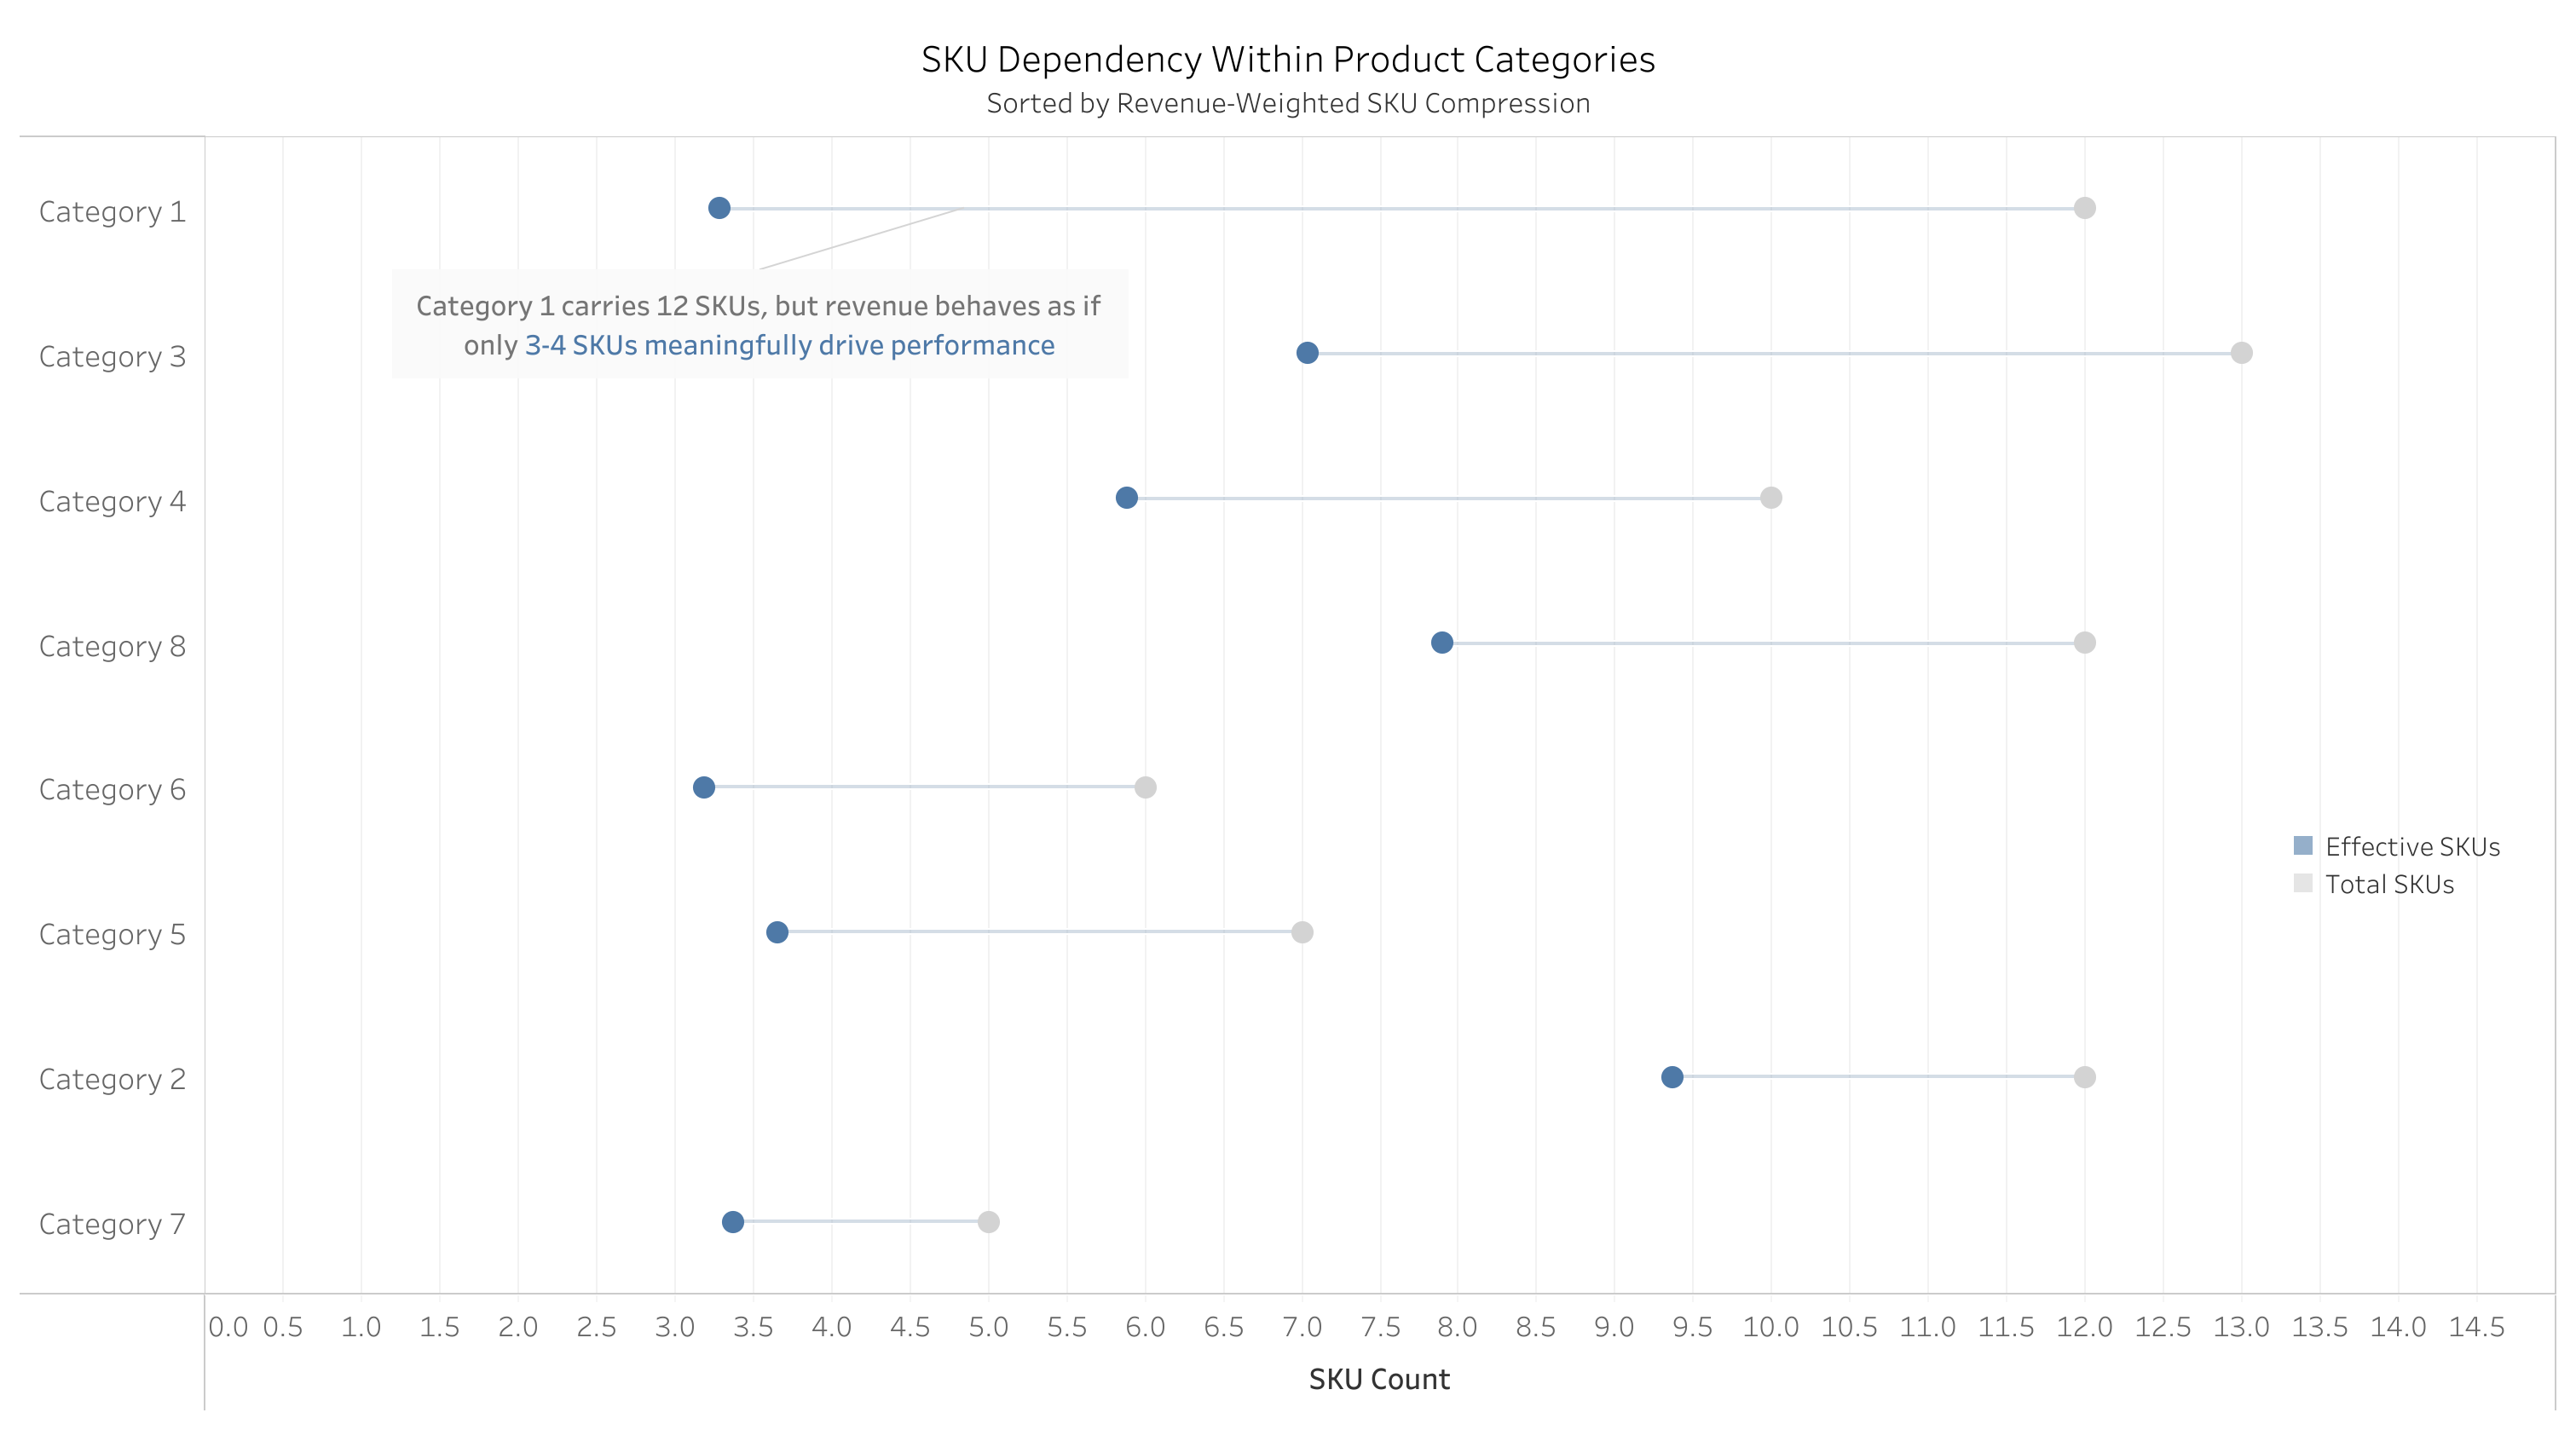
Category 1 (~21% of revenue) shows the highest compression gap (HHI: 0.304). SKU-level dependency is localized to select categories - not customer or category-level.
Structural Risk Summary
Primary exposure is product-level fragility, not customer or category dependency. Risk is localized at the SKU level within high-revenue categories.
Strategic Recommendations